Dataman Oscilloscope Spectrum Analyzer Software
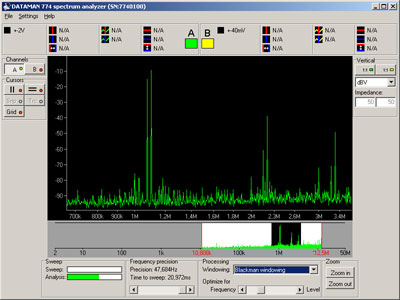
The Spectrum Analyzer software turns your oscilloscope into an easy to use spectrum analyzer. Simply connect the signal to oscilloscope’s input, select the desired bandwidth to be analyzed and the software does the rest. No additional control of the oscilloscope is needed. The vertical channel sensitivity is adjusted according the input amplitude’s waveform automatically and timebase setting and buffer length adjustment (for Dataman 570 and 770 series) is done automatically according to the selected bandwidth.
Windowing is applied during the analysis. The rectangular, triangular, Blackman, Hamming and Hanning windows are available.
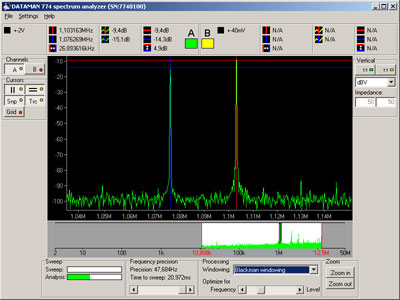
The main display is intuitive and easy to use, positioning the desired spectrum is achieved by simply dragging it in any direction on the screen. In addition, the small “navigator” screen is also available which displays the spectrum of the complete bandwidth while the detailed view is shown in the main screen.
There are two horizontal and two vertical cursors for level and frequency measurement. The cursors are equipped with several useful features such as the snap to peak for vertical and level tracking for horizontal cursors.
The Spectrum Analyzer software is available for the 520, 570 and 770 series oscilloscopes and can be downloaded free.